

Graph Neural Networks for Detecting Shell Company Networks: A Compliance Professional’s Guide to Graph AI
Shell companies and front entities remain the architecture of choice for financial criminals seeking to layer illicit funds, obscure beneficial ownership, and exploit jurisdictional arbitrage. Despite decades of regulatory tightening — from FATF Recommendations 24 and 25 to the UAE’s Cabinet Decision 58/2020, the UK’s Economic Crime (Transparency and Enforcement) Act 2022, and Singapore’s MAS Notice 626 — the fundamental challenge persists: how do you see through a deliberately opaque corporate structure to identify who truly controls and benefits? Traditional compliance tools — rules-based screening, linear database lookups, manual CDD review — were designed for a world of straightforward corporate hierarchies. They systematically fail when confronted with circular ownership loops, nominee director networks, and multi-jurisdictional layering structures that span dozens of entities across multiple registries. Enter Graph Neural Networks (GNNs) — a class of deep learning models purpose-built to reason over interconnected data. By modelling entities, directors, shareholders, accounts, and transactions as nodes and edges in a network graph, GNNs can detect structural patterns that are invisible to linear analysis. This post is a detailed walkthrough of how GNNs work, why they matter for beneficial ownership compliance, and how leading financial institutions are deploying them against shell company networks across the UAE, UK, and Singapore.
◆
The Shell Company Problem: Why Traditional Approaches Fail
Shell companies are not inherently illegal — many serve legitimate purposes such as holding intellectual property, facilitating mergers, or managing cross-border tax structures. The compliance challenge is distinguishing legitimate structures from those designed to conceal criminal proceeds, evade sanctions, or facilitate corruption. A typical illicit shell network might involve a UAE-registered holding company owned by a British Virgin Islands entity, whose shares are held by a nominee director linked to a Singapore-domiciled trust, with ultimate beneficial ownership traced (if at all) to a politically exposed person in a third country. Each layer adds opacity. Each jurisdiction adds complexity. Each nominee arrangement adds deniability.
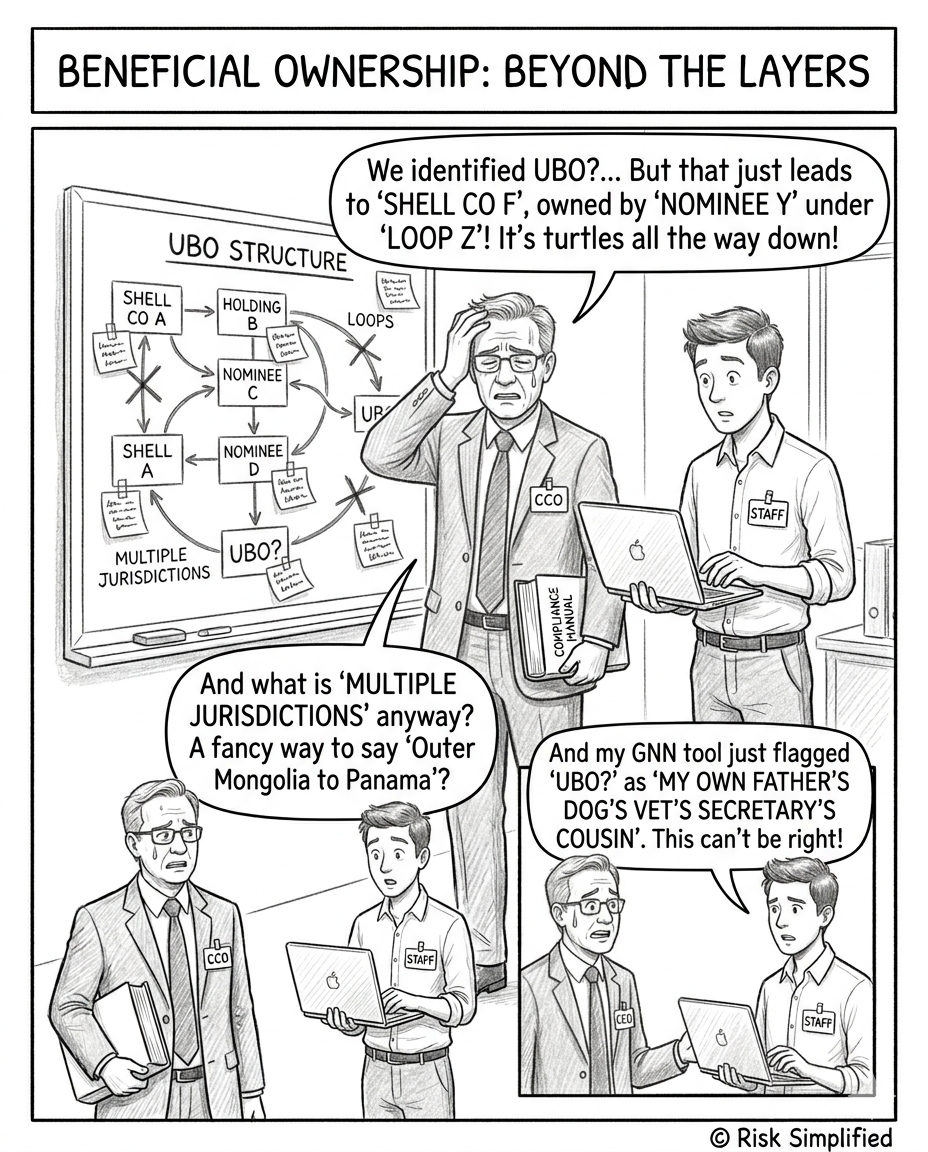
Traditional KYC processes typically review each entity in isolation, verifying documents one layer at a time. This linear approach routinely misses circular ownership structures — where Entity A owns Entity B, which owns Entity C, which in turn owns Entity A — because no single entity review reveals the loop. Regulators in all three jurisdictions have explicitly flagged this gap as a systemic weakness.
The scale of the problem is staggering. With millions of corporate entities registered across global jurisdictions, compliance teams reviewing UBO chains manually are fighting an information asymmetry battle they cannot win. This is precisely where graph-based AI provides a structural advantage.
◆
How Graph Neural Networks Actually Work: A Visual Explainer for Compliance Professionals
A Graph Neural Network operates on data structured as a graph — a mathematical representation consisting of nodes (entities such as companies, individuals, accounts, or addresses) and edges (relationships such as ownership, directorship, transactions, or shared registered agents). Unlike tabular data analysis, which treats each record independently, a GNN learns from the neighbourhood of each node — aggregating information from connected entities across multiple hops to build a rich, context-aware representation of every node in the network.
Ingest data from corporate registries (Companies House, ACRA, UAE commercial registers), internal CDD records, transaction systems, and external data providers. Each legal entity, natural person, account, and address becomes a node. Ownership stakes, directorships, transactional flows, and shared attributes (e.g., same registered agent or address) become edges.
The GNN iteratively propagates information across the graph. In each layer, every node aggregates features from its neighbours — learning, for example, that a company’s directors also serve on boards of entities in high-risk jurisdictions, or that its parent company shares a registered address with 47 other entities. After multiple rounds, each node’s representation encodes its entire structural context.
The model classifies nodes or subgraphs as suspicious or benign based on learned structural patterns — circular ownership loops, nominee arrangements, hub-and-spoke structures with disproportionate transactional volumes, and multi-jurisdictional layering. Training data is derived from historical enforcement actions, SAR filings, and labelled typologies.
Flagged structures are presented to investigators with visual graph outputs, highlighting the specific nodes, edges, and structural features that triggered the alert. This explainability layer is critical — regulators expect institutions to articulate why a structure was flagged, not merely that it was.
The critical advantage of GNNs over traditional network analysis (e.g., simple graph traversal or link analysis) is their ability to learn latent structural patterns from labelled training data. A rules-based system can detect a pre-defined circular ownership loop. A GNN can detect novel variations of circular ownership that the rules author never anticipated — including structures deliberately designed to evade known detection heuristics.
◆
Regulatory Drivers: UAE, UK, and Singapore Are Running Out of Patience
The regulatory expectation across all three jurisdictions is convergent and unambiguous: look through the legal structure and identify who actually controls and benefits. What differs is the enforcement intensity and the specific mechanisms each jurisdiction employs.
2020 — UAE Cabinet Decision 58/2020
Mandated UBO disclosure for all onshore entities. FIs must verify and maintain accurate beneficial ownership data. CBUAE’s CDD expectations under FATF R.24/25 require institutions to identify and verify the natural persons who ultimately own or control corporate customers — even through multiple layers of intermediary entities.
2022 — UK Economic Crime (Transparency and Enforcement) Act
Introduced the Register of Overseas Entities, requiring foreign entities owning UK property to declare beneficial owners. The NCA has explicitly flagged the failure of manual PSC (Persons with Significant Control) review to detect concealed control relationships as a systemic gap in the UK’s AML framework.
2023–2024 — Singapore MAS Notice 626 Enhancements
MAS has sharpened its expectations around risk-proportionate, technology-enabled CDD. Singapore’s role as a regional holding company hub makes nominee director and circular shareholding arrangements a high-frequency typology. ACRA filings, combined with account relationship data, are the natural input for GNN-based detection.
“The corporate structures used to launder money are becoming more complex, more layered, and more deliberately designed to defeat traditional compliance controls. Financial institutions must invest in technologies that can match the sophistication of the threat.”— FATF, Guidance on Transparency and Beneficial Ownership (Updated 2023)
GNNs vs. Traditional Compliance Tools: A Comparative Analysis
To understand the operational impact of GNNs, it helps to compare them directly against the traditional compliance toolkit that most institutions still rely upon.
Do not position GNNs as a replacement for human investigators. The most effective deployments use GNNs to prioritise and enrich the analyst queue — surfacing high-risk structures with visual graph context so that trained investigators can make faster, better-informed decisions. This hybrid model also satisfies regulatory expectations around human oversight of automated systems.
◆
Real-World Typologies: What GNNs Catch That Rules Miss
To make this concrete, consider three anonymised typology examples drawn from enforcement patterns across the UAE, UK, and Singapore:
Typology 1 — The Circular Ownership Loop (UAE): A Ras Al Khaimah free zone company is owned 100% by a BVI entity, which is in turn owned by a Seychelles IBC, which holds a 40% stake back in the original RAK company through a separate holding vehicle. The remaining 60% is held by a nominee. No single entity filing reveals the loop. A GNN traversing the ownership graph detects the cycle in milliseconds and flags the concealed UBO — a PEP from a sanctioned jurisdiction who controls all three intermediary entities through undisclosed trust arrangements.
Typology 2 — The Shared Infrastructure Network (UK): Forty-seven entities registered at Companies House share the same registered office address, the same company secretary, and three rotating directors. Individually, each entity appears unremarkable. The GNN identifies the cluster as a structurally anomalous community — a formation service creating shelf companies in bulk, several of which are linked to overseas entities flagged in the Register of Overseas Entities with incomplete PSC disclosures.
Typology 3 — The Nominee Director Web (Singapore): A Singapore-incorporated holding company has a single local nominee director serving on the boards of 23 other entities across ACRA’s registry. The GNN maps the director’s network and identifies that 18 of these entities transact exclusively with a single counterpart in a high-risk jurisdiction, with no discernible commercial rationale. MAS Notice 626 requires the FI to assess control structures with rigour — the GNN provides the structural evidence to trigger enhanced due diligence.
Relying solely on ownership percentage thresholds (e.g., the common 25% UBO threshold) is a known blind spot. Sophisticated laundering networks deliberately structure ownership at 24.9% across multiple nominees to stay below regulatory triggers. GNNs detect these distributed control patterns by analysing the aggregate structural position of connected nominees — not just individual shareholdings.
Frequently Asked Questions
◆
The bottom line for compliance professionals: Beneficial ownership opacity is no longer a problem regulators will tolerate you solving slowly. The UAE, UK, and Singapore are converging on a clear expectation — you must look through the structure, identify the human beings who control and benefit, and do so with technology that matches the sophistication of the threat. Graph Neural Networks are not a future concept; they are a deployable capability today. If your institution has cross-border corporate client exposure — and most do — the question is no longer whether to adopt graph-based AI for shell company detection, but how quickly you can integrate it into your CDD and ongoing monitoring workflows. Start with a pilot on your highest-risk corporate portfolio segment, benchmark detection performance against your existing rules, and build the business case from there. The regulators are watching, the enforcement actions are accelerating, and the structural advantage that GNNs provide is too significant to leave on the table.